Introduction to R

CLICC Classroom C 320 Powell Library, 10740 Dickson Court, Los Angeles, CA, United States

RSVP FOR EVENT R is statistical package that runs on Windows, Macintosh and UNIX platforms. This class is designed for people who are just starting to use R. The students in the class will have a hands-on experience using R for doing statistics, graphics, and data management. The class notes are the scripts for the...
Read More

Free

Introduction to Statistical Software

Research Commons (RC) Classroom 11630F Young Research Library, 280 Charles E Young Drive North, Los Angeles, CA, United States

REGISTER HERE This hands-on workshop will introduce some commonly used statistical software packages, including R, SAS, SPSS, and Stata. Taught by Christine Wells (Institute for Digital Research and Education).  

Introduction to R

Young Research Library, West Classroom 280 Charles E Young Dr N, Los Angeles, CA, United States

REGISTER HERE Overview of R functionality. Taught by Andy Lin (Institute for Digital Research and Education).

Introduction to Regression in R

IDRE Portal 5628 Math Sciences Building, 520 Portola Plaza, Los Angeles, CA, United States

REGISTER FOR EVENT Regression analysis is one of the most powerful statistical techniques that is used to explain variability in a response (dependent) variable as a function of one or more predictor (explanatory or independent) variables.  The aim of this seminar is to help participants increase their skills in using regression analysis with R.  The seminar...
Read More

Free

R Markdown Basics

IDRE Portal 5628 Math Sciences Building, 520 Portola Plaza, Los Angeles, CA, United States

REGISTER FOR EVENT R Markdown files integrate text, Markdown, and R code into dynamic documents that weave together plain text, formatted text, and the output of the R code.  The resulting dynamic reports can be produced in many formats, including HTML documents, HTML slideshows, LaTeX pdf, Beamer slideshows, MS Word doc, books, scientific articles, and...
Read More

Free

Introduction to Jupyter

IDRE Portal 5628 Math Sciences Building, 520 Portola Plaza, Los Angeles, CA, United States

The Jupyter Notebook is a computing tool that allows users to edit and run Python, R, Julia (and many other programming languages) inside a web browser. Furthermore, it is a powerful tool that allows users to combine live code, text, and visualizations in an interactive, shareable, reproducible document. It has been growing in popularity in...
Read More

Free

Introduction to ggplot2

IDRE Portal 5628 Math Sciences Building, 520 Portola Plaza, Los Angeles, CA, United States

The ggplot2 package is a widely-used and well-supported system for creating eye-catching graphics in R.  In this interactive seminar, you will learn the underlying grammar of graphics that forms the philosophical framework of ggplot2, giving you the power to create publication-quality figures intuitively.  The workshop is interactive, in which attendees are encouraged to participate in...
Read More

Free

Running Applications on the Hoffman2 Cluster: Case Studies

IDRE Portal 5628 Math Sciences Building, 520 Portola Plaza, Los Angeles, CA, United States

This class will address the process of creating Matlab standalone executables and running Matlab in batch, as well as running Abaqus python scripts. Example of how to submit array jobs using Abaqus, R and other applications. Can my simulations be submitted as array jobs? Bring your own problem. Also, Jupyter Notebooks: another way to run...
Read More

Free

Decomposing Interactions in R

IDRE Portal 5628 Math Sciences Building, 520 Portola Plaza, Los Angeles, CA, United States

In regression, we are often interested in an interaction, which is the modification of the effect of an independent variable by another. Interactions can be decomposed in three ways, by 1) testing each effect against zero, 2) testing differences among effects, and 3) graphing. This workshop will demonstrate how to do all three analyses in...
Read More

Free

Decomposing Interactions in R (Part II)

IDRE Portal 5628 Math Sciences Building, 520 Portola Plaza, Los Angeles, CA, United States

Description This is the second part of the seminar on decomposing interactions in R. Methods of decomposing continuous-by-categorical and categorical-by-categorical interactions will be reinforced with hands-on exercises. Requirements A laptop with R installed is required for the hands-on exercises; and prior attendance of the first part of the seminar is recommended but not required. Download...
Read More

Free

Introduction to R

IDRE Portal 5628 Math Sciences Building, 520 Portola Plaza, Los Angeles, CA, United States

R is a programming environment that runs on Windows, Macintosh and UNIX platforms. This class is designed for people who are just starting to use R. The students in the class will have a hands-on experience using R for doing statistics, graphics, and data management. The class notes are the scripts for the class. The...
Read More

Free

Software Carpentry Workshop – R

IDRE Portal 5628 Math Sciences Building, 520 Portola Plaza, Los Angeles, CA, United States

REGISTER HERE This is a two day workshop.  Software Carpentry aims to help researchers get their work done in less time and with less pain by teaching them basic research computing skills. This hands-on workshop will cover basic concepts and tools, including program design, version control, data management, and task automation. Workshop Website: https://ucla-data-archive.github.io/2020-01-15-ucla/ (for more information on...
Read More

R Markdown

IDRE Portal 5628 Math Sciences Building, 520 Portola Plaza, Los Angeles, CA, United States

R Markdown files integrate text, Markdown, and R code into dynamic documents that weave together plain text, formatted text, and the output of the R code.  The resulting dynamic reports can be produced in many formats, including HTML documents, HTML slideshows, LaTeX pdf, Beamer slideshows, MS Word doc, books, scientific articles, and websites.   This seminar...
Read More

Free

Regression Models with Count Data

IDRE Portal 5628 Math Sciences Building, 520 Portola Plaza, Los Angeles, CA, United States

Regression models for data with a count outcome is part of the family of generalized linear models. This workshop is designed to give an overview on regression model with count data. The workshop includes a broad range of analyses available for count regression models such as Poisson regression, negative binomial, zero-inflated Poisson, and zero-inflated negative...
Read More

Free

R Data Management

Zoom

This workshop introduces R packages and functions that help users import, transform and manage their data in preparation for analysis.   The seminar focuses on the “tidy data” philosophy encouraged y the “tidyverse” collection of R packages, but draws on other packages for useful functions as needed.  Topics include data import, transforming variables, string functions, missing...
Read More

Free

Introduction to Survey Data Analysis in R

Zoom

This workshop will show how descriptive analyses, both numerical and graphical, can be done with continuous and categorical variables. Subpopulation analysis will be discussed, and then examples of OLS regression and logistic regression will be considered. Attendance is restricted to researchers from the University of California.  The information for the Zoom meeting will be sent...
Read More

Free

Managing Python and R Packages Using Conda on Hoffman2 Cluster

Zoom

Anaconda is a popular, free, and open-source distribution of Python and R packages for scientific computing and data analysis. Many users prefer using Anaconda on the personal computer instead of manually installing individual packages not only for convenience but also for taking advantage of Anaconda's ability to resolve version conflicts and package dependencies. On the...
Read More

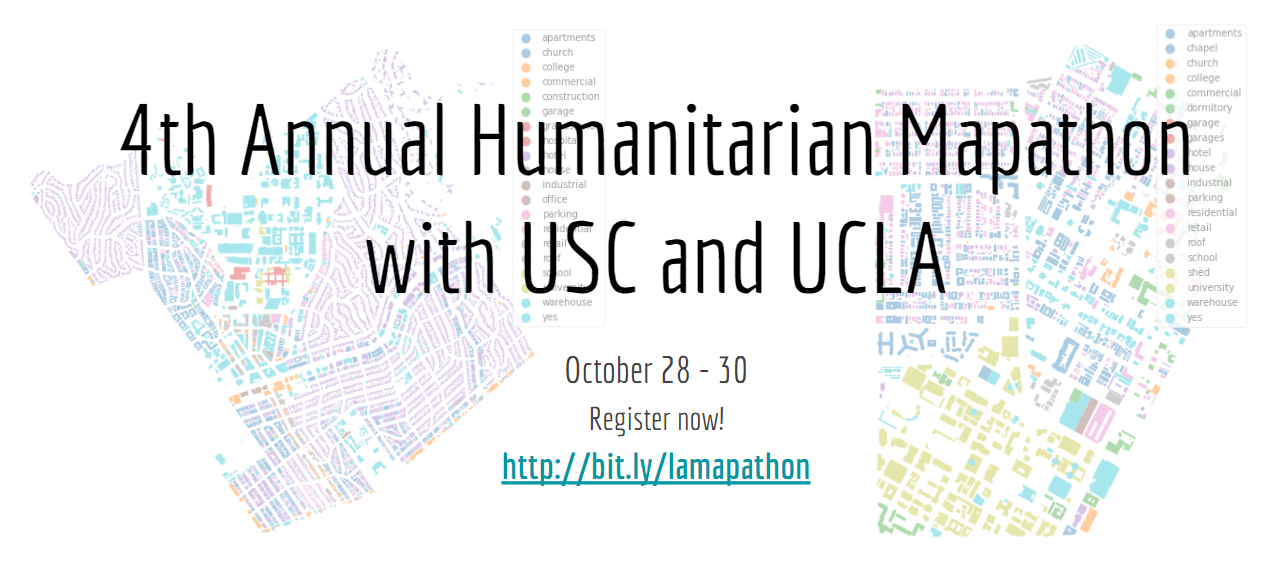
4th Annual Humanitarian Mapathon with USC and UCLA

Zoom

REGISTRATION IS NOW OPEN, RSVP HERE!  Wednesday October 28th, 10am (PDT): Welcome message and humanitarian map training Thursday October 29th: Continue mapping and a day of workshops9am Open Street Map with Python 11am Open Data and Tableau 1pm GIS with R 3pm Introduction to QGIS Friday October 30th, 10am (PDT): Wrap-up and closing Keynote with...
Read More

Introduction to R

Zoom

Please RVSP here. Workshop will be conducted in Zoom in PST time. Invites are sent out the day before the workshop. R is a powerful statistical package that runs on many platforms, including Windows, Macintosh and Unix. This class is designed for people who are just getting started using R. The students in the class...
Read More

Free

R Markdown Basics

Zoom

Please REGISTER in advance here. Workshop will be conducted in Zoom in PST time. Invites are sent out the day before the workshop.   R Markdown files integrate text, Markdown, and R code into dynamic documents that weave together plain text, formatted text, and the output of the R code.  The resulting dynamic reports can...
Read More

Free

Multiple Imputation in R

Zoom

Please REGISTER in advance here. Workshop will be conducted in Zoom in PST time. Invites are sent out the day before the workshop.   The purpose of this workshop is to discuss commonly used techniques for handling missing data and common issues that could arise when these techniques are used. In particular, we will focus...
Read More

Free

R Graphics: Introduction to ggplot2

Zoom

Zoom registration required: https://ucla.zoom.us/meeting/register/tJAucO-orzkvHtGtJFXfN76vvx75TY-1QxIG This seminar teaches the “grammar” of graphics that underlies the ggplot2 package, allowing the user to build eye-catching, publication-quality graphics layer-by-layer. We cover the basic elements of the grammar of graphics, including aesthetics, geoms, scales, and themes, and we will show you how easy ggplot2 makes it to integrate these elements...
Read More

Introduction to Regression in R

Zoom

Zoom registration required: https://ucla.zoom.us/meeting/register/tJAocumvrTkoHdVjqIGxWTdErUZLo_Z5hccE Regression analysis is one of the most powerful statistical techniques that is used to explain variability in a response (dependent) variable as a function of one or more predictor (explanatory or independent) variables. The aim of this seminar is to help participants increase their skills in using regression analysis with R....
Read More

Confirmatory Factor Analysis (CFA) in R with lavaan

Zoom

Zoom registration required: https://ucla.zoom.us/meeting/register/tJwkcuiqrjovGdFdq0u6EebmpiiX_KW00ohH This workshop will cover basic concepts of confirmatory factor analysis by introducing the CFA model and looking at examples of a one-factor, two-factor and second-order CFA. Concepts such as model identification, standardized solutions, and model fit statistics such as the chi-square statistic, CFI, TLI and RMSEA will be covered. The focus...
Read More

Generalized Linear Models in R

This workshop is designed to give an overview on generalized linear models. The workshop introduces the basic theory of generalized linear models and their implementation in R. We will talk about a broad range of regression models such as Logistic regression, Poisson regression, negative binomial, zero-inflated Poisson, and zero-inflated negative binomial and how to run...
Read More

R Markdown Basics

Zoom

Registration: https://ucla.zoom.us/meeting/register/tJwpd-uoqDIvG91UKYByaA-7Xcbn4V38rA1k R Markdown files integrate text, Markdown, and R code into dynamic documents that weave together plain text, formatted text, and the output of the R code.  The resulting dynamic reports can be produced in many formats, including HTML documents, HTML slideshows, LaTeX pdf, Beamer slideshows, MS Word doc, books, scientific articles, and websites.  ...
Read More

Running Applications on the Hoffman2 Cluster, Part II

Zoom

Registration link: https://ucla.zoom.us/meeting/register/tJIvd-igpjMiGNVkod90GFNhBTuT7pwRfj5- The Hoffman2 Cluster is a powerful computational resource for the UCLA research community. This workshop is part of a three-seminar series designed to introduce users to the Hoffman2 Cluster environment and to clarify the process of porting applications or using applications already available on the cluster. It also addresses how to port...
Read More

Introduction to Generalized Linear Regression Models in R

Zoom

Registration: https://ucla.zoom.us/meeting/register/tJUud-6uqTwiGtNZEtt6vy5VApsl6AE8BJVM In this workshop we discuss generalized linear models and why and when we need to use them. We will discuss several generalized linear modes such as logistic, Poisson, and negative binomial and how we run them in R. The seminar briefly reviews regression concepts as necessary, but it is assumed that participants have...
Read More

Using Container on HPC resources

This workshop will go over how to use container on HPC resources. Containers are a great way to run scientific software on various HPC platforms. Users can create a ‘virtual’ OS to easily install any application and transfer it to any system with container software. This workshop will cover how to build and use containers...
Read More

Introduction to Survival Analysis in R

Zoom

Survival analysis models time-to-event outcomes. This workshop introduces usage of the survival package in R for some of the most commonly used survival methods. Topics include data setup, Kaplan-Meier estimates and curves, log-rank tests, fitting the Cox proportional hazards model, assessing the proportional hazards assumption, and modeling time-varying covariates. Experience in both survival analysis and...
Read More

R Graphics: Introduction to ggplot2

Zoom

This seminar teaches the “grammar” of graphics that underlies the ggplot2 package, allowing the user to build eye-catching, publication-quality graphics layer-by-layer. We cover the basic elements of the grammar of graphics, including aesthetics, geoms, scales, and themes, and we will show you how easy ggplot2 makes it to integrate these elements to make informative and...
Read More

Hoffman2 Happy Hour: Using Anaconda on Hoffman2

Zoom

Anaconda (https://www.anaconda.com/) is a distribution of R and Python that can be used to easily install many popular data science, biostats, and other packages. This Hoffman2 Happy Hour will go discus using Anaconda on Hoffman2. This can be applied to using Anaconda on various other HPC resources. We will go over creating conda environments and...
Read More

Introduction to R

Zoom

This workshop introduces the functionality of R, with a focus on data analysis. Topics include: using RStudio, R coding basics, importing and cleaning data, simple data analysis functions, and brief introductions to R graphics (base and ggplot2) and RMarkdown. This workshop is interactive with coding exercises throughout. Any questions about this workshop can be emailed...
Read More

Introduction to Regression in R

Zoom

This seminar will introduce some fundamental topics in regression analysis using R in three parts. The first part will begin with a brief overview of the R environment, and then simple and multiple regression using R. The second part will introduce regression diagnostics such as checking for normality of residuals, unusual and influential data, homoscedasticity...
Read More

Zero-inflated and Hurdle models for Count Data in R

Zoom

This workshop introduces zero-inflated poisson, zero-inflated negative binomial, and hurdle models for count data, which are two-part models used when more zeros are found in the data than expected with typical count distributions. We will discuss the formulations of the two parts of each model, the interpretation of model parameters, and how to run these...
Read More

Missing Data in R

Zoom

The purpose of this seminar is to discuss techniques and introduce some useful packages in R for handling missing data. In particular, we will focus on multiple imputation and how to perform it using the R package, mice: “Multivariate Imputation by Chained Equations”. As prerequisite to this seminar, we suggest participants have basic knowledge in...
Read More

Decomposing and Visualizing Interactions in R

Zoom

In regression, we are often interested in an interaction, which is the modification or moderation of the effect of an independent variable by another. Understanding interactions involves interpreting the regression coefficients, estimating and testing simple effects and their differences, and visualizing the interaction. This workshop will teach you how to do all of these thing...
Read More

R Graphics: Introduction to ggplot2

Zoom

This workshop teaches the “grammar” of graphics that underlies the ggplot2 package, allowing the user to build eye-catching, publication-quality graphics layer-by-layer. We cover the basic elements of the grammar of graphics, including aesthetics, geoms, scales, and themes, and we will show you how easy ggplot2 makes it to integrate these elements to make informative and...
Read More

Hoffman2 Happy Hour: R and Python

Zoom

This Hoffman2 Happy Hour is designed to equip participants with the knowledge and skills to harness the power of High-Performance Computing (HPC) for data analysis. The workshop focuses on two popular programming languages, R and Python, and provides step-by-step guidance on installing essential packages for HPC environments. Participants will learn how to navigate the intricacies...
Read More

R Data Management

Zoom

This workshop explores tools in R for data management, with a focus on the several of the packages in the “tidyverse” collection. Topics covered include summarizing variables, subsetting rows and columns, generating group-level variables, combining data sets, reshaping data, and working with string and datetime data. This workshop is designed to be interactive, so some...
Read More

Introduction to Programming in R

Zoom

This workshop is an introduction to R as a programming language. The aim of this workshop is to improve programming skills of R users who have some familiarity with R as a statistical package and would like to extend their R skills. We will talk about how R users can write functions to replace repetitive...
Read More

Introduction to Linear Regression in R

Zoom

This workshop teaches the basics of the linear regression model, the foundation for most other regression models. Topics include understanding the model equation, continuous and categorical predictors, interpreting the model estimates, and diagnostics for assessing model assumptions. The workshop is intended to be interactive, with examples and exercises in R, and assumes only introductory exposure...
Read More

Zero-inflated and Hurdle models for Count Data in R

Zoom

This workshop introduces zero-inflated poisson, zero-inflated negative binomial, and hurdle models for count data, which are two-part models used when more zeros are found in the data than expected with typical count distributions. We will discuss the formulations of the two parts of each model, the interpretation of model parameters, and how to run these...
Read More

Events List Navigation

UCLA OIT